

Bugs can remain dormant in a system for a long time, until they suddenly manifest themselves in weird and unexpected ways. The deeper in the stack they are, the more surprising they tend to be. One such bug reared its head within our columnar datastore in May this year, but had been present for more than two years before detection.
This bug started causing minor data losses in observability data and caused queries to crash unexpectedly. Paul Osman, a former Honeycomb engineer (and our first employee board member), led the investigation and wrote about it on his blog. The investigation was a team effort, and everyone involved back then found it absolutely fascinating. As soon as Paul’s post hit the press, we knew we wanted to repost it here with his permission—and with the queries he could no longer get his hands on.
The symptom
A customer alerted us that a specific query consistently generated an error. The particular error message they saw typically indicates a timeout, which tends to mean that there’s an availability problem with our columnar datastore. However, this case was consistently reproducible. This led us to believe there was a problem with this specific query—not with database availability. There was a problem with the data causing errors in the query processor—running the same query with different time windows produced no error, providing further evidence for the ‘bad data’ theory.
Technical details
Honeycomb stores events in a custom columnar datastore called Retriever. Retriever stores all customer events and processes queries for customers.
All customer events flow through a distributed event store, Kafka. Honeycomb maintains a mapping of customer datasets to Kafka partitions (higher volume datasets get more partitions). When an event is received by Honeycomb’s ingest service, it is published to one of the Kafka partitions that the customer dataset is mapped to. At the other end of the Kafka partitions, two redundant Retriever nodes consume events and persist them to their local disks. Event logs are append-only, and retriever nodes have fast NVMe disks.

When a Retriever node consumes an event, it writes the event to separate files per column. Retriever groups events into segments. Segments are routinely rolled out (when I worked at Honeycomb, they were marked read-only, and a new segment was created when the segment hit 1 million events, 1GB of data, or when 12 hours had passed).
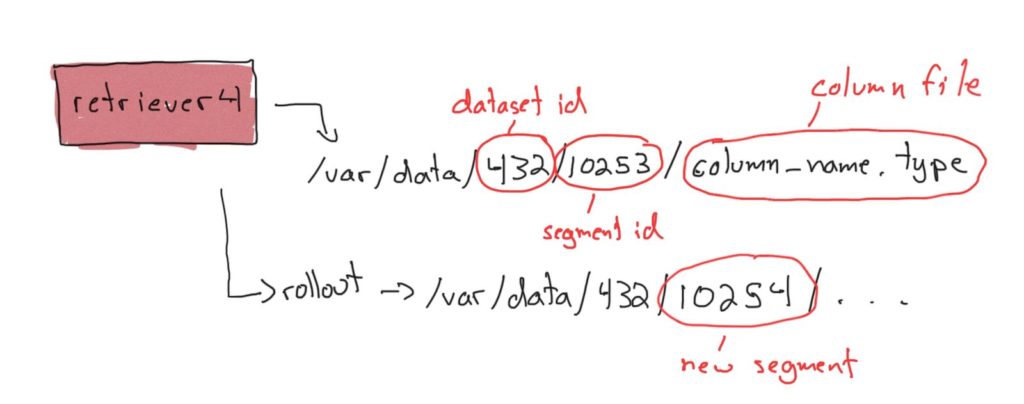
An out-of-band process manages the lifecycle of segments. Segments go from being live and having data written to them, to being read-only but still stored on disk, to being read-only and stored in S3, and finally to being tombstoned and eventually deleted when the data ages out (it is then no longer queryable).
When a query is processed, each Retriever node that could have data for the query processes the data it has on disk. Data from segments in S3 is retrieved and processed with Lambda functions, which merge with the results from the Retriever nodes. AWS Lambda functions are a core part of how Retriever processes queries.
Custom instrumentation to the rescue
Okay, back to the problem. At this point, I assumed that there was a piece of bad data causing the queries to fail. I narrowed it down to a one-minute range of data, so I was confident in this hypothesis. However, I assumed it was a problem with invalid data (e.g., a division by zero error somehow being thrown by Honeycomb’s derived column DSL).
One of my coworkers started looking at traces and noticed that the Lambda functions had an