


Abstract
The pupillary light response is an important automatic physiological response which optimizes light reaching the retina. Recent work has shown that the pupil also adjusts in response to illusory brightness and a range of cognitive functions, however, it remains unclear what exactly drives these endogenous changes. Here, we show that the imagery pupillary light response correlates with objective measures of sensory imagery strength. Further, the trial-by-trial phenomenological vividness of visual imagery is tracked by the imagery pupillary light response. We also demonstrated that a group of individuals without visual imagery (aphantasia) do not show any significant evidence of an imagery pupillary light response, however they do show perceptual pupil light responses and pupil dilation with larger cognitive load. Our results provide evidence that the pupillary light response indexes the sensory strength of visual imagery. This work also provides the first physiological validation of aphantasia.
Editor’s evaluation
This is a rigorous study of the relation between the vividness of visual imagery and the pupillary light response that can result from it. It provides evidence for the absence of imagery in individuals that self-report as aphantasic. The results will likely be of interest to researchers in a range of disciplines such as psychology, neuroscience and philosophy.
Introduction
Our pupil’s ability to change size is an important physiological response that adjusts the amount of light hitting the retina to optimize vision and protect the retina. Pupils constrict in response to brightness whereas they dilate in response to dark conditions (known as the pupillary light response or reflex); while these responses are related, they are considered to be driven by different neural pathways (see Mathôt, 2018 for a review). These involuntary pupil responses were once thought to be driven only by afferent visual stimulation, or automatic activation from emotional responses (Bradley et al., 2008; Partala and Surakka, 2003), however, recent studies suggest that pupil size is sensitive to higher order perceptual and cognitive processes. For example, subjective interpretation of equiluminant stimuli, such as greyscale images of the sun elicit greater pupil constriction than those of the moon (Binda et al., 2013b). The target of covert visual attention can drive pupillary light responses (Binda et al., 2013a), as can visual working memory content (Zokaei et al., 2019), but see Blom et al., 2016. Further, evidence suggests that it might be mental imagery that is driving some of these cognitively induced pupil responses (Laeng and Sulutvedt, 2014) and recent work has shown that there are pupillary light responses even when reading or listening to words conveying some level of brightness (Mathôt et al., 2017). Hence, it remains unknown if the variations in pupil response to equiluminant stimuli are due to high-level semantic content or low-level visual imagery.
Visual imagery is considered a useful and often essential tool in many aspects of cognition. It plays an important role in the retrieval of items from short- and long-term memory (Pearson, 2019), visual working memory (Keogh and Pearson, 2011; Keogh and Pearson, 2014; Pearson and Keogh, 2019), acquisition of language (Just et al., 2004), and spatial navigation (Sack et al., 2005; Guariglia and Pizzamiglio, 2007). It is also used for simulating both past and potential future events (Schacter et al., 2012; Schacter and Madore, 2016), the latter often as a form of self-motivation for goal attainment (Szpunar et al., 2007). As essential to cognition as it might appear, large individual differences exist in visual imagery and its vividness. Some people report imagery as so vivid it feels almost like perception, while a small percentage of otherwise healthy people seemingly do not have the capacity for visual imagery at all – they report that when they think about how an object looks, there is no sensory-like experience of it whatsoever (Galton, 1880). This condition has been recently termed ‘aphantasia’ (Zeman et al., 2015); it can be congenital, persisting throughout one’s lifetime (Zeman et al., 2015) or acquired (Zeman et al., 2010), is associated with a range of differences in general cognition (Dawes et al., 2020; Keogh et al., 2021a, Keogh and Pearson, 2021), including dampened fear responses to imagined scary scenarios (Wicken et al., 2021). The existence of aphantasia has also been established using objective techniques that measure the low-level sensory elements of imagery (Keogh and Pearson, 2018).
The rationale of the current study was to accurately and objectively utilize individual differences in mental imagery (both in the general population and aphantasia) to provide strong evidence that it is the sensory strength and subjective vividness of imagery that drives the cognitive pupillary light response. Similar rationale has been previously used by linking the vividness and objective sensory strength of imagery to behavioural or neurological measures (Bergmann et al., 2016; Shine et al., 2015; Wassell et al., 2015). If imagery plays a causal role in endogenous pupil size changes, then individual differences in imagery should be reflected in these measures.
Here, we utilized both subjective and objective measures of visual imagery ability and show that, within the same individual, greater pupillary light responses during imagery are associated with reports of stronger and more vivid imagery. We then used this task to compare imagery strength between individuals and test the veracity of the self-reported lack of imagery in aphantasia. We show that while aphantasic individuals display pupil contraction to perceptual brightness and dilation with effort (cognitive load), they do not show any evidence of pupil change in response to attempts at imagery – providing the first objective physiological evidence confirming the existence of aphantasia.
Results
The imagery pupillary light response in the general population
In the pupillometry imagery task (based on Laeng and Sulutvedt, 2014; see Figure 1A), participants who reported having visual imagery were presented with one or four ‘Bright’ or ‘Dark’ triangles for 5 s (see Figure 1—figure supplement 1 for images used). Following this they viewed a blank screen for 8 s (which allowed any after-images to fade) and were then instructed to imagine the prior image/s for 6 s, after which they rated the vividness of their imagery from 1 to 4. Pupils showed a clear pupillary light response to perceptual images (Figure 1B; perception section; a significant effect of perceptual luminance F(1, 41) = 190.02, p < 0.001.) This trend was mirrored in the imagery period showing a significant main effect of imagery luminance (Figure 1B, box insets: imagery section; F(1, 41) = 67.42, p < 0.0001), indicating that imagery also demonstrates a pupillary light response. Post hoc analysis using the Bonferroni correction for multiple comparisons found that for both Set-Size-One and Set-Size-Four, the pupil size in the Dark condition was significantly greater than in the Light condition during imagery (p < 0.001 and p < 0.05, respectively, see Figure 1C). There was no main effect of set size during perception F(1, 42) = 2.67, p = 0.11. However, there was a significant main effect of set size during imagery F(1, 41) = 6.48, p = 0.015, with less constriction/more dilation for Set-Size-Four (when averaged across the brightness conditions). This is consistent with previous studies suggesting that pupil size is influenced by cognitive load (Kahneman and Beatty, 1966; Laeng et al., 2011; van der Wel and van Steenbergen, 2018). Post hoc analysis also demonstrated that in the Bright condition, Set-Size-Four resulted in significantly more pupil dilation during imagery than Set-Size-One (p = 0.001). However, in the Dark condition pupil dilation during Set-Size-Four imagery was not significantly different to Set-Size-One (p = 0.266).
(A) Pupillometry imagery experiment timeline. Each trial began with the presentation of a white fixation cross at the centre of a grey screen (baseline screen) for 1 s. An image was then presented at the centre of this grey screen for 5 s (either one or four triangles of varying brightness, see Figure 1—figure supplement 1 for illustrations of all stimuli). Participants were instructed to focus on the stimuli during this time and memorize its size, orientation, and level of brightness. Next, a black screen with a white fixation cross was presented for 8 s, allowing the perceived after-image to completely fade and pupils to dilate back to equivalent resting levels. The grey baseline screen was then presented again for 6 s. During this time, participants were cued (via two auditory beeps) to actively start imagining the stimuli observed previously during that trial, while maintaining focus on the fixation cross. These beeps were presented 1 s into the grey screen period leaving 5 s of imagery time. Lastly, participants were prompted to report the vividness of their imagery during those previous 5 s on a scale of 1–4 (1 being ‘not vivid at all – no shape appeared in imagery’; 4 being ‘very vivid – almost like seeing it’) via key response. (B) Mean pupil size waveforms for the general population, presented as mm change from baseline. Left panel: data averaged across the course of a trial for Bright (red lines) and Dark (blue lines) conditions for the general population. Right panels: Set-Size-One and Set-Size-Four conditions are shown separately during the imagery period (i.e. pupil size from seconds 15 to 20). Shaded error bands represent the standard error of the mean (± standard error of the mean [SEM]). (C) Mean pupil size change from baseline during imagery (i.e. averaged from seconds 15 to 20 of trials) of Bright (red bars) and Dark stimuli (blue bars). (D) Pupil-difference scores (difference in pupil size during imagery between bright and dark conditions) as a function of subjective vividness ratings for Set-Size-One and Set-Size-Four conditions. Data points represent one participant. Error bars indicate ± SEM, calculated across participants. *p < 0.05, ***p < 0.0001.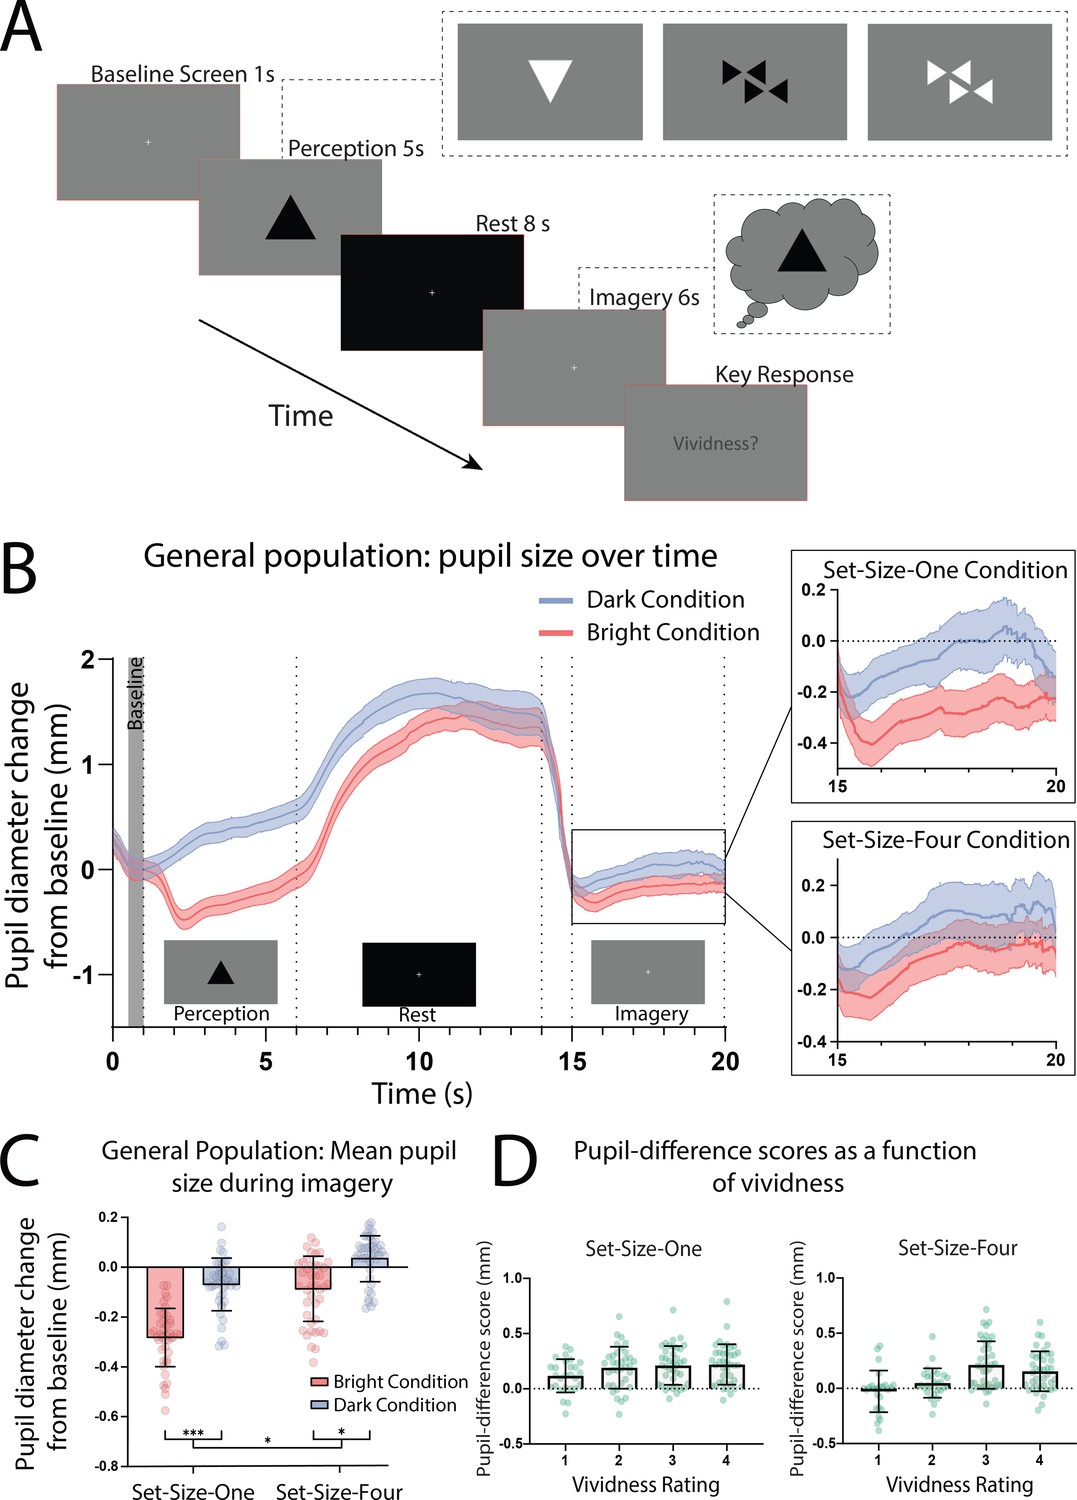
Pupillary response task schematic and eye-tracker results for the general population.
Prior behavioural work suggests we have reasonable metacognition of visual imagery, that is we are able to estimate the strength of imagery on a trial-by-trial basis (Pearson et al., 2011; Rademaker and Pearson, 2012). Here, we compared pupil responses to the trial-by-trial ratings of vividness. Pupil-difference scores are shown as a function of intraindividual vividness ratings for Set-Size-One and Set-Size-Four (see Figure 1D). A 2 × 4 linear mixed-effects analysis (2 (set size: 1, 4) × 4 (vividness rating: 1, 2, 3, 4)) demonstrated there was a significant effect of vividness (χ2(3) = 49.54, p = 1.004e−10), with larger pupillary light response for more vivid imagery trials (for both set sizes, see Figure 1D and fixed effects estimates in Supplementary file 1). These data demonstrate that the pupillary light response tracks the phenomenological vividness of visual imagery from moment to moment.
If the sensory strength of imagery is indeed driving the imagery pupillary light response, then the degree to which this response occurs should be related to independent objective measures of imagery strength in each individual. To assess this, we utilized the binocular rivalry method (Pearson, 2014; Pearson et al., 2008), which allows the objective assessment of the sensory strength of imagery, without relying on any subjective reports (Chang and Pearson, 2018). This is achieved by measuring the degree to which an individual’s imagery biases subsequent binocular rivalry perception. We compared pupil-difference scores (imagery of dark stimuli–bright stimuli, such that larger scores indicate a larger pupillary light response) with imagery strength measured using the binocular rivalry paradigm, in which higher priming scores indicate stronger imagery (Figure 2A; Pearson et al., 2008; Pearson et al., 2011). Within the general population, degree of pupil change in the Set-Size-One condition correlated positively with imagery strength, using Pearson’s correlation coefficient (rp(41) = 0.62, p = <0.0001, see Figure 2B: green circles and green trendline). The Set-Size-Four pupil data set violated normality (Shapiro–Wilk test, p = 0.003), therefore, the Spearman’s correlational coefficient was used to assess its relationship with binocular rivalry priming. A significant positive correlation was found between Set-Size-Four pupil-difference scores and binocular rivalry priming (rs(41) = 0.46, p = 0.002, see Figure 2C: green circles and green trendline). This provides further evidence that the sensory strength of imagery content is driving the imagery pupillary light response.
(A) Example of an imagery trial for the binocular rivalry paradigm. Participants were cued to imagine either a red or green Gabor pattern prior to binocular rivalry with the letter ‘R’ or ‘G’ (750 ms). Participants then imagined the image for 6 s, after which they were presented with the binocular rivalry display (750 ms) and were asked to indicate which image was dominant. Trials where participants reported seeing the pattern they were cued to imagine as dominant were denoted as ‘primed’ trials. The number of primed trials divided by the total number of trials (excluding mock trials and mixed percepts) was used to calculate a percent primed score for each participant. (B) Correlation between visual imagery strength, as measured by the pupillary response task (pupil-difference score: difference between bright and dark conditions) and visual imagery strength as measured by the binocular rivalry task. Set-Size-One (left) and Set-Size-Four (right) conditions are shown. Scatterplots show the general population (green circles and green trendline) and aphantasic individuals (yellow triangles and yellow trendline) data. Correlation coefficients refer to the general population only (green trendline). All data points represent one participant.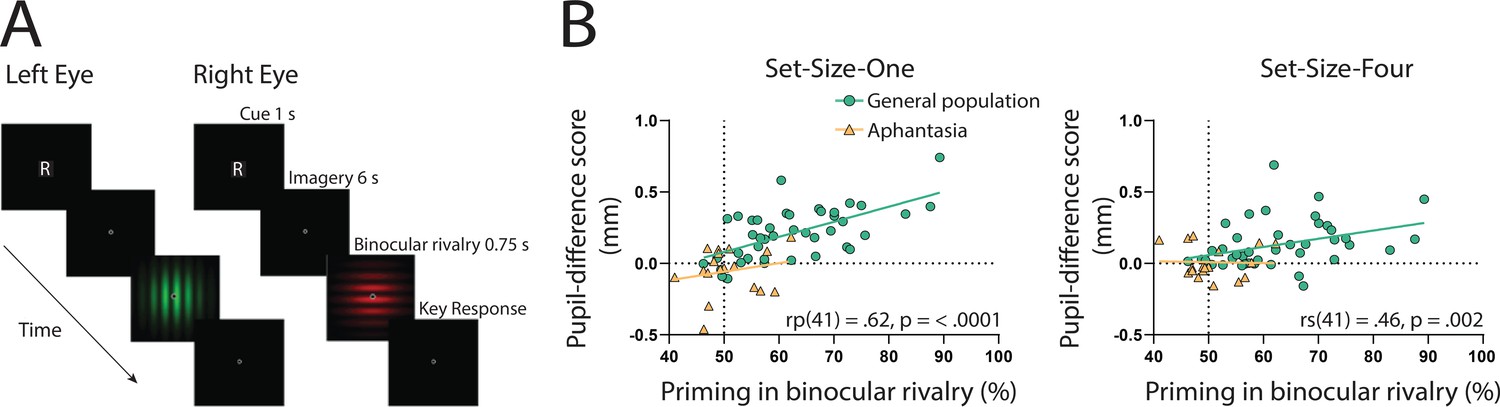
Binocular rivalry task schematic and correlational results.
Aphantasia and the imagery pupillary light response
Our results indicate that the strength of the content of imagery drives the imagery pupillary light response in participants who experience visual imagery. The involuntary nature of this response provides a valuable objective measure of imagery strength. Accordingly, we sought to utilize this finding to test the veracity of a condition called aphantasia, that is if these individuals truly lack visual imagery, they should not show a pupillary light response to imagined images. However, if aphantasic individuals do show an imagery-based pupillary light response, one might interpret this as a form of imagery existing, but below threshold for conscious phenomenological awareness. We ran this same study in 18 aphantasic participants and compared their performance to that of the general population. These participants had contacted the lab reporting their lack of visual imagery and asked to participate in our research. They were also unaware of the goals and hypotheses of the current study. Aphantasia was confirmed in these individuals using self-report questionnaires (Vividness of Visual Imagery Questionnaire [VVIQ] score <32) and by means of our binocular rivalry priming method (priming <65%), based on cut-off points used in previous research (Keogh and Pearson, 2018).
Here, we again found a strong effect of stimulus luminance in the perceptual phase of the task for the aphantasic participants (Figure 3A: perception section; F(1, 17) = 81.18, p < 0.001), reflecting a functional pupillary light response. However, we found no significant effect of luminance on pupil size during imagery Figure 3A, box insets: imagery section; F(1, 17) = 0.193, p = 0.67 and Figure 3B shows the lack of pupil diameter change for bright stimuli (red bars) and dark stimuli (blue bars). Similarly, to the general population, there was no main effect of set size during perception F(1, 17) = 1.92, p = 0.18, however interestingly, there was a significant main effect of set size during imagery F(1, 17) = 6.185, p = 0.02, with greater pupil diameters for Set-Size-Four compared to Set-Size-One (when averaged across the brightness conditions). This suggests that the aphantasic participants were actively engaging in the imagery task and exerting greater cognitive effort for the larger set size (van der Wel and van Steenbergen, 2018). In comparison to the general population, 61.11% (11/18) of the aphantasic individuals had difference scores that were lower than or equal to 0 for set size one as compared to 9.5% (4/42) of the general population (see Figure 2B). To confirm this absence of an imagery effect in the aphantasia population, we compared the pupil-difference score obtained when comparing the bright and dark conditions for the control and aphantasia groups, and computed a Bayes Factor (H0: score = 0; H1: score ≠ 0; see Materials and methods). Controls showed very strong evidence for H1 (BF10 > 1010; Bayesian one-sample t-test), whereas the aphantasia population showed evidence for the null effect (BF01 = 3.180). A direct comparison between the control and aphantasia groups using a Bayesian repeated measure analysis of variance (ANOVA; see Materials and methods) showed very strong evidence for an effect of group (BF10 > 106). Finally, and as expected, pupil-difference scores (imagery of dark stimuli–bright stimuli) did not significantly predict imagery strength (measured using the binocular rivalry paradigm) for the aphantasic population (Figure 2B: yellow triangles; Set-Size-One: rp(17) = 0.20, p = 0.44); Set-Size-Four: (rp(17) = −0.08, p = 0.76). It should be noted that we could not perform an analysis on the vividness data in the same way as was done with the general population (Figure 1D) as the aphantasic individuals did not have any variation in their vividness ratings, reflecting their lack of subjective visual imagery (see Figure 3—figure supplement 1).
(A) Mean pupil size waveforms over time. Left panel: data averaged across the course of a trial for Bright (red lines) and Dark (blue lines) conditions for the aphantasic population. Right panels: Set-Size-One and Set-Size-Four conditions are shown separately during the imagery period. (B) Mean pupil size change from baseline during imagery (i.e. averaged from seconds 15 to 20 of trials) of Bright (red bars) and Dark stimuli (blue bars). Error bars indicate ± standard error of the mean (SEM), calculated across participants. *p < 0.05.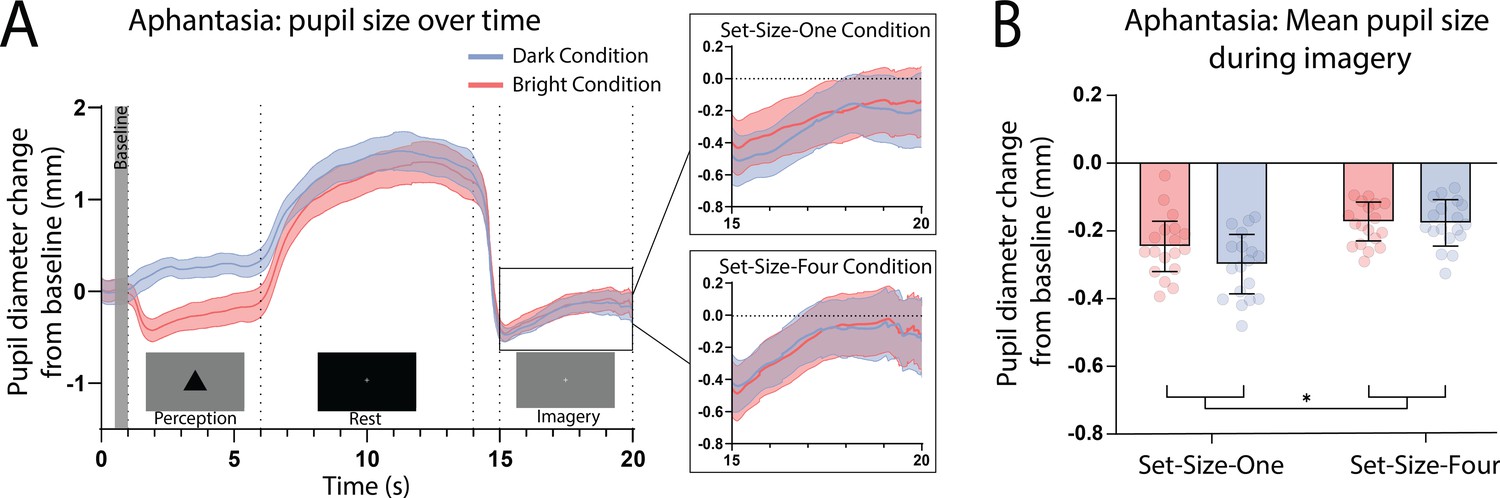
Pupillary response eye-tracker results for the aphantasic population.
Age disparities between the groups are a potential confounding variable. This factor is of particular importance because the sensitivity of the pupillary light response, as well as maximum pupillary constriction velocity and acceleration, are thought to decline with age, beginning at 40–50 years old (Fotiou et al., 2007; Lobato-Rincón et al., 2014). However, trial time-course pupil waveforms are very similar for both general and aphantasic populations (Figures 1B and 3A, respectively). Both groups exhibited similar levels of pupil change during the perception phase of the task. Furthermore, a two-way ANCOVA was run on pupil-difference scores between general population and aphantasic groups with age as a covariate. Levene’s test and normality checks were carried out and the assumptions were met. We found a significant difference in pupil-difference score (F(1, 57) = 4.763, p = 0.033) between the groups when accounting for age. This provides evidence that decreased pupil responsiveness with age was not driving the observed effects.
Another possible explanation of our findings could be that the passive viewing of the perceptual images, lingering visual persistence and sluggish pupil responses could be driving our results. If this is the case, we would expect that pupil diameter during the perception of the images should correlate with pupil size during imagery for the corresponding images. Further, the pupillary light reflex during perception should be more pronounced in the control than the aphantasic populations. To investigate this possible alternative explanation of our data we first assessed the correlations between pupil diameter during perception of bright and dark images for Set-Size-One and -Four and their corresponding imagery conditions (control participants only). We found there were no significant correlations between any of the perception and imagery conditions, or the difference scores for set size one and four (all p > 0.40, see Figure 2—figure supplement 1). This lack of a correlation suggests that those individuals who have the largest pupillary light response while viewing the images, do not also have the greatest imagery driven pupillary light responses, making it unlikely that the pupil response while seeing the image is driving the mental imagery pupillary response. Next, we assessed whether the aphantasic individuals demonstrated any significant difference in their pupil responses to perceptual stimuli by running a 2 (image: bright and dark) × 2 (set size: 1 and 4) × 2 (group: aphantasic and controls) repeated measures ANOVA on the pupil diameter during the 5-s perceptual period of the task (see Figure 1A for task timeline). There was no main effect of imagery group F(1, 58) = 1.15, p = 0.29 and no significant interactions between imagery groups and any other factor (all p > 0.22, see Figure 3—figure supplement 2). These findings suggest the observed pupil responses during the imagery period of the task is unlikely to be a carry-over effect of the previous sensory response to perceived images.
Pupil size has been shown to depend on eye position (Drewes et al., 2014; Gagl et al., 2011) and the preparation to make a saccade to an upcoming image (Jainta et al., 2011; Mathôt et al., 2015; Wang et al., 2018). Pupil modulation and eye position are also both controlled by largely overlapping circuitry (Wang and Munoz, 2018). It could then be the case that group differences in eye position or saccades (either while viewing or imagining the triangles) may explain our data. To assess how eye movements and position (eccentricity) might be related to our findings, we analysed both eye position and saccades made while viewing and imagining the images, to see if these differed as a function of group. Eccentricity was extracted using the ‘saccades’ package in R (von der Malsburg, 2015) and saccades were detected using a velocity-based algorithm (Engbert and Kliegl, 2003) using the same R package. There were no significant differences between the groups for the number of saccades made during perception or imagery of the stimuli (see Figure 3—figure supplement 4 and Figure 3—figure supplement 5). There were also no differences in mean eccentricity values when comparing the two groups (Figure 3—figure supplement 3), and no correlation with eccentricity and the pupillary light response (Figure 2—figure supplement 3), binocular priming (Figure 2—figure supplement 4), or vividness ratings (Figure 2—figure supplement 5), suggesting that differences in fixation or eye movements between the two groups is unlikely to drive the observed group differences in regard to the mental imagery pupillary light response.
Taken together these data from the general population and aphantasic individuals suggest that it is the content and ability to form vivid visual images, not the voluntary attempt to do so or the semantic content, that is driving the imaginary pupillary light response, providing the first evidence that these pupil changes are due to the sensory strength of imagery content and are not driven by higher-level semantic content.
Discussion
Our results provide novel evidence that our pupils respond to the vividness and strength of a visual image being held in mind, the stronger and more vivid that image, the greater the pupillary light response. Our data provide the first evidence linking the pupil response to strength and vividness of imagery, not only between individuals, but also within an individual as imagery vividness fluctuates from moment to moment (Dijkstra et al., 2017; Pearson et al., 2011; Rademaker and Pearson, 2012). Finally, we show that, as a group, there is no evidence of this pupil response in individuals without mental imagery (aphantasia).
How might the content of mental imagery be driving the pupillary light response? One interpretation of these findings is that this imagery pupillary response is a by-product of the top-down modulation of midbrain-level visual circuitry (pretectal olivary nucleus, superior colliculus; Joshi and Gold, 2020), which occurs when imagining vividly, resulting in these regions interpreting this modulation as coming from external or afferent stimuli, and responding accordingly (Larsen and Waters, 2018; Schwalm and Rosales Jubal, 2017). In this case, the pupil would be responding to imagined luminance in much the same way that it responds to retina-based light sources. This is consistent with current data and models proposing shared mechanisms between visual imagery and perception (Dijkstra et al., 2017; Dijkstra et al., 2019; Ganis et al., 2004; Naselaris et al., 2015; Xie et al., 2020) and the idea that visual imagery functions much like a weak version of afferent perception (Pearson, 2019), supporting the idea that the stronger or more vivid an individual’s imagery is, the more ‘perception like’ their imagery is.
An alternative mechanistic account might be that pupil diameter is encoded along with the original visual information for example bright object, and hence is replayed during memory decoding to form the mental image. This would be in a similar manner to theories proposing a functional role of eye movements during imagery generation from memory (Wang et al., 2020). It will be up to future work to uncover the exact mechanist account of imagery induced pupil changes.
Here we also provide the first objective physiological evidence of an extreme lack of visual imagery in aphantasic individuals. Aphantasia has largely been defined using subjective means (Dawes et al., 2020; Jacobs et