


Intel Processor Trace is a hardware technology that can record all
program execution flow along with timing information accurate to
around 30ns. As far as I can tell almost
nobody uses it, seemingly because capturing the data is tricky and,
without any visualization tools, you’re forced to read enormous text
dumps.
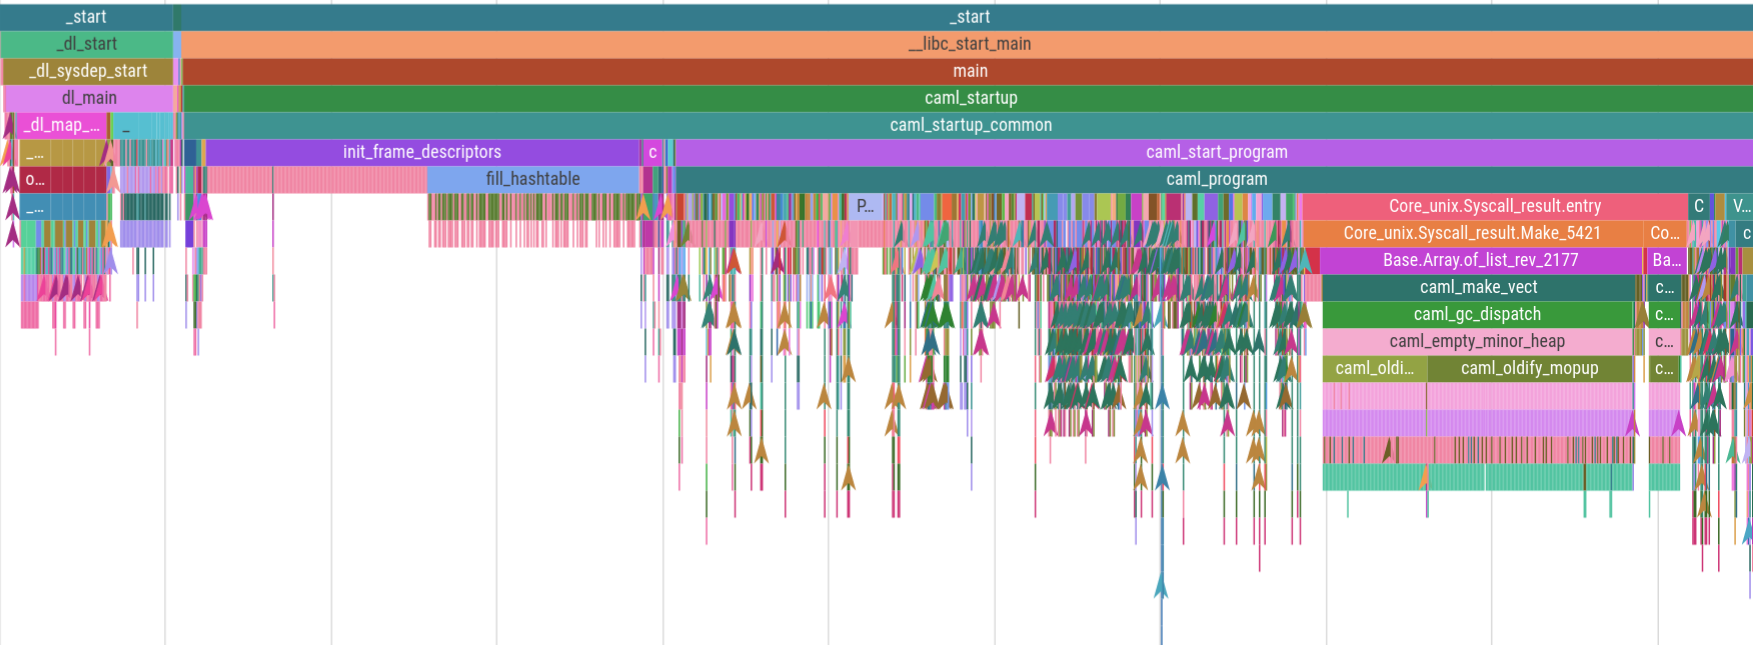
Magic-trace is a tool we built and open-sourced to make it easy to
capture a trace of around 10ms leading up to a function call you
chose to instrument, and then visualize the call stack on a timeline
where you can zoom in and see every function call and how long it
took. Here’s a captured trace of 5ms of OCaml program startup:
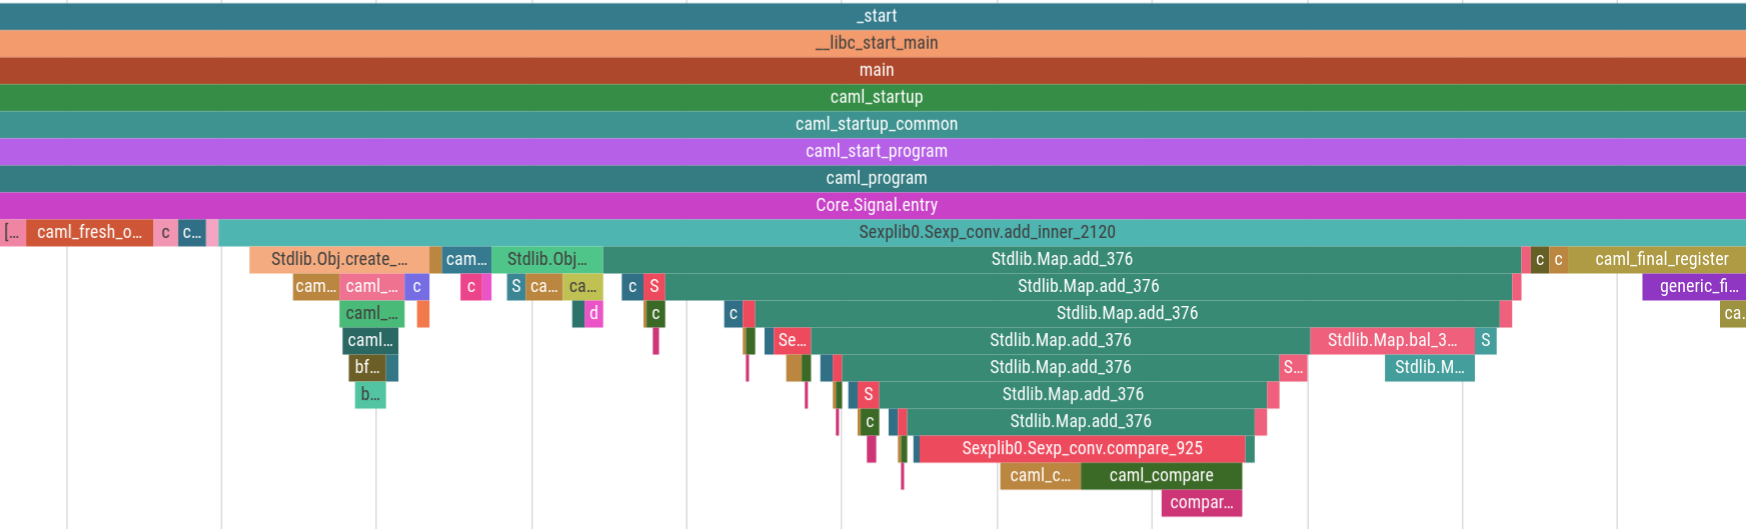
And here’s the same trace zoomed in to an arbitrary 500 nanoseconds.
The thin red events are 1-3 nanoseconds:
Recently we’ve been using this tool to diagnose performance issues that
would be very difficult to solve with other tools. Using it is as easy
as adding a Magic_trace.take_snapshot call to your code (or using a
fuzzy-finder to select any existing function), then running
magic-trace attach and using the fuzzy-finder to select your process.
It’ll spit out a trace you can view in Google’s Perfetto trace
viewer.
In this post we’ll go over why Processor Trace is so special, the
difficulties of building something on top of a hardware technology
almost nobody uses, how we were beset by a kernel bug and a hardware
bug, and the kinds of problems we’ve been able to solve with the
tool.
Why Intel Processor Trace, and why not?
Let’s look at the major types of performance analysis tools and why
magic-trace serves a different niche:
Sampling profilers interrupt the program every 250 microseconds or
so, sample the current call stack, and then summarize them all
together. These are great for giving you a sense of where your program
is spending its time. However, at Jane Street we have lots of
high-performance trading systems that spend nearly all of their time
waiting for network packets that we want to respond to in far less
than the 250-microsecond sampling interval. Sampling profilers are
approximately useless for diagnosing latency issues on that scale:
you’d be lucky to get one sample in the code you care about!
Even in more traditional systems, you may want to diagnose short but
rare tail latency events, or notice the difference between a function
being called 10 times more than you expected or one call to it taking
10 times longer than expected, which a sampling profiler can’t tell
you.
Instrumentation-based tracing either patches or compiles probes
into a program that record when certain functions start and end, then
typically visualizes them on an interactive timeline UI. We re-use the
UI from the Perfetto tracing system for magic-trace, although we
needed to fork it to better handle events at the scale of single
nanoseconds. High-performance tracing systems like tracy even
manage to get the overhead down to around 2ns per call (we built a
similar system for OCaml and open-sourced it). However,
instrumenting every single function is risky (e.g. you might triple the
cost of a 1ns function that’s called everywhere) so typically they
require manual instrumentation, and sometimes your performance problems
are in an app or function you haven’t annotated.
Hardware tracing like Intel Processor Trace (IPT) has the
advantages of tracing but doesn’t require any instrumentation, and can
have much lower overhead than instrumenting everything. They use a very
efficient format that only encodes just enough info to reconstruct the
control flow – for example conditional branches take one bit. Time
overhead for IPT varies from 2-20% depending on the program, with every
one of our programs I’ve benchmarked experiencing less than a 10%
slowdown and usually under 5%.
There are a few downsides to Processor Trace though:
- Many VMs don’t support it and it needs a post-Skylake Intel processor
(some other vendors have similar tech; AMD doesn’t yet). - You have no choice but the full 1GB/s firehose (with the exception of
some limited filtering options) so it’s difficult to store and
analyze longer traces. With instrumentation you can manually pick the
important functions and economize on trace size. - Decoding is slow because it needs to follow along with disassembled
instructions from the binary and reconstruct the flow. Other than
specialized decoders for fuzzing, the fastest decoder is 60x slower
than real time.
A minimum viable product
During Jane Street’s 2021 summer internship, I was talking to
some colleagues about our issues profiling very short interesting time
segments. I noted that Intel Processor Trace would be great for this
but that it was really hard to use. Then I realized that with the
trace visualization library I had just written, and some features from
the Processor Trace documentation I had just read, I could see a path
to a user-friendly tool. So I drafted a new intern project document,
and for the second half of his internship, Chris Lambert and I worked
on putting it together.
The key idea behind quickly making a useful tool was to limit the
scope:
- We’d focus on the circular buffer mode, where it overwrites old data
until you snapshot it after something interesting happens. Processor
Trace can save all data, but doing so creates 1GB of trace file
per second. - We’d trigger the snapshots based on a function call in the target
program. There are lots of other possibilities for deciding when to
sn