

Health warning
This article is about using Fortune’s Algorithm to generate Voronoi
Diagrams in O(nlogn) time. If I’d known how hard it would be I wouldn’t
have started it. If you are intending to implement it with the intent to
actually use it, rather than as an exercise, I would recommend not using
Fortune’s. Unless you are doing a lot of large diagrams – like
multiple large diagrams every second – I’d suggest looking at an O(n^2)
implementation, which I’ve heard is much easier. Or even better, using a
library. While it was very frustrating at times, it is a cool looking
algorithm when you get it working.
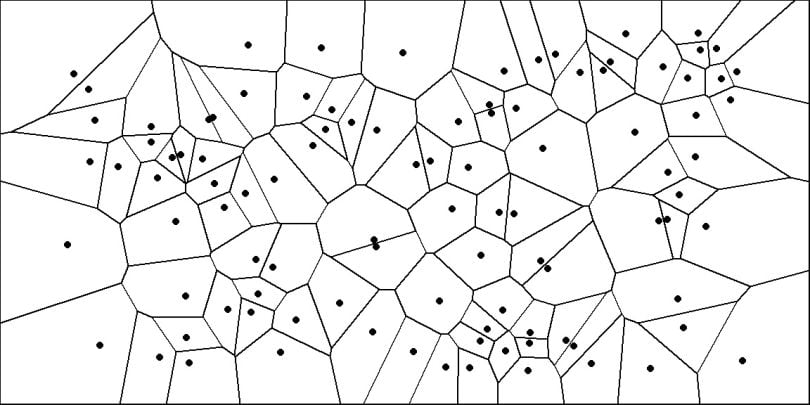
What is a Voronoi diagram?
A Voronoi diagram is method of partitioning a plane into regions. It
is often used to procedurally generate maps.
You pick a bunch of points on a plane called ‘sites’, and the region,
or ‘cell’, corresponding to that site is the area enclosing every point
which is closer to that site than to any other site.
Put another way, the edge of each cell is where it is equidistant to
two sites (top drawing). The ‘corners’ of the cells, where edges meet,
are called ‘Voronoi Vertices’. These are the points which are
equidistant from three sites (bottom drawing).

There are a few methods for generating the diagrams. A popular one is
Fortune’s Algorithm, and that’s the one I’ll describe here.
Fortune’s Algorithm
Seen visually, this method creates a line which ‘sweeps’ from the
left edge of the plane to the right, pixel by pixel – called the
sweep-line. When the line encounters a site it creates
what looks like a ‘bubble’ around it (actually, a parabolic arc). The
bubble grows as the sweep line gets further away. The magic happens when
two arcs from two different sites collide: the point of collision
becomes the edge of the cells, it being equidistant between the two
points. And when two of those edges collide, it creates a
corner in the diagram. The ‘frontier’ of all the active bubbles is
called the beachline, I guess because it sort of looks
like a coast?
In reality you don’t actually go pixel by pixel. Interesting things
happen at certain points which can be calculated – irritatingly called
events – and we just look at those. There’s a lot to
unpack here, and we need to do some groundwork before really getting
into it.
Glossary of Terms
There are a few terms that are core to understanding the process.
I’ll define them briefly here, but most of them won’t make sense until
you understand how they relate to the algorithm. they’re just here for
reference so you can come back to them later.
A site, sometimes called a seed, is a 2d point. The
sites are what determine the shape of the resulting Voronoi diagram,
because the edges of the cells are equidistant from two sites.
The sweep line is the vertical line that sweeps
across the region. As the sweep line passes each event in the event
queue, that event is processed.
The beach line is a line comprised of a series of
arcs. When an event is processed, the beach line is affected by either
adding or removing arcs. Each arc corresponds to a site, though each
site can have multiple, or no, arcs on the beachline at any given point
in time.
An intersection is a point where two arcs on the
beachline meet eachother. These intersections are also equidistant
between the sites to which the arcs relate.
The event queue is where the site and circle events
are stored, ordered by ascending x-coordinate. The algorithm progresses
by popping the next event off the queue, and processing it, until there
are none left. This is a conceptually a priority queue, though isn’t
implemented as one here.
A site event is one of the two types of event on the
event queue, and the simpler one. It is defined by the coordinates of a
corresponding site. Processing a site event results in a new arc being
added to the beach line. Since the sites are known when you begin the
algorithm, they are added to the queue before the algorithm starts
processing events.
A circle event is the other type of event on the
queue. It is defined by the three arcs which sit on the perimeter of the
circle. Apart from the center and radius of the circle, another
important attribute of the circle is the circle point,
which is the right-most point of the circle. It’s the x-coordinate of
this circle point which determines where it sits in the event queue.
Circle points are not known ahead of time, but are generated as arcs are
added to or removed from the beach line. Processing a circle event
results in an arc being removed from the beach line, and a Voronoi
Vertex and two half edges being created.
A Voronoi Vertex is a point equidistant between 3
sites, where three equiedges meet. They are the corners of the cells of
the Voronoi diagram. They are also the center of the circles of circle
events.
An equiedge is an line which is equidistant between
two sites in the Voronoi diagram.
An incomplete edge is a line which has a fixed point
on one side, but the other side is defined as the intersection of two
parabola focus points. Since the parabola intersections change with the
sweep line, this end of the edge is not fixed. Incomplete edges become
‘complete’ when the two incomplete edges meet eachother (at a circle
event), and in doing so generate Voronoi Vertices and half edges.
A half edge is a part of the Voronoi data structure.
It has a origin point (a Voronoi Vertex) and a ‘twin’ half edge. Half
edges are generated from the ‘completion’ of an incomplete edge.
A Parabolic Tangent
The concept and properties of a parabola are really important to this
algorithm. So we need to be able to represent
parabola.1
Parabola are usually defined using an equation y=ax^2+bx+c
or some slight variation on that. We use a different, but equivalent
formulation called the ‘locus definition’. You can define a parabola
using two things: A 2d coordinate called the focus
point, and a line called the
directrix2.
The parabola consists of all points which are equally distant from the
focus point and the directrix. If we restrict ourselves to a vertical
directrix, then the directrix becomes a single number representing the
x-coordinate of the line.
This how you can calculate the points of the parabola. Derivation is
not going to be covered here, and it’s not actually important for the
algorithm. But it’s useful for drawing
it3.
def parabola_x(focus:Vector2, y: int, d: int):
  x = y - focus.y
  x *= x
  x /= focus.x - d
  x += focus.x + d
  x *= 0.5
  return x

def draw_parabola(f:V2, d:int, y0:=0, yn:=HEIGHT, color:=BLACK)
  for y in y0..<yn:
    Draw
6 Comments
bambax
There is an implementation of that algorithm in JS by Raymond Hill (of uBlock Origin fame):
https://github.com/gorhill/Javascript-Voronoi
I toyed with it here to have it move:
https://animations.adgent.com/voronoi.html
vvern
I made an implementation in clojurescript that animates the algorithm as it goes a while back: https://voronoi.ajwerner.net/#/app-diagrams
It’s a very beautiful algorithm.
However, after that project I sort of came to dislike Fortune’s algorithm because it isn’t numerically stable with floating point numbers. If you have points that are colinear, or nearly colinear in fp, things can break. The delaunator is better in this regard iirc: https://github.com/mapbox/delaunator
Jarmsy
A few years back I made this 3d visualisation https://x.com/KangarooPhysics/status/1253336959755251716
talkingtab
D3js has a new implementation
https://github.com/d3/d3-delaunay
at the bottom of that page is a discussion of the sweep algorithm used and a list of other (non-javascript) language implentations.
The original d3-voronoi is deprecated but can be found here:
https://github.com/d3/d3-voronoi
Kloopvram
Cool!
Interesting that D3 moved away from Fortune's algorithm to https://mapbox.github.io/delaunator/ because it
"is 5-10× faster than d3-voronoi to construct the Delaunay triangulation or the Voronoi diagram, is more robust numerically, has Canvas rendering built-in, allows traversal of the Delaunay graph, and a variety of other improvements."
chefandy
Houdini’s 3D Voronoi tools are fun.