


Debugging is difficult. Debugging across multiple languages is especially challenging, and debugging across devices often requires a team with varying skill sets and expertise to reveal the underlying problem.
Yet projects often require using multiple languages, to ensure high performance where necessary, a user-friendly experience, and compatibility where possible. Unfortunately, there is no single programming language that offers all of the above, demanding that developers become versatile.
This post shows how a RAPIDS team approached debugging multiple programming languages, including the use of GDB to identify and resolve deadlocks. The team is dedicated to designing software to accelerate and scale data science solutions.
The bug featured in this post was part of the RAPIDS project that was identified and resolved in the summer of 2019. It involves a complex stack with multiple programming languages, primarily C, C++, and Python, as well as CUDA for GPU acceleration.
Documenting this historical bug and its resolution serves a few goals, including:
- Demonstrating Python and C debugging with GDB
- Presenting ideas on how to diagnose deadlocks
- Developing a better understanding of mixing Python and CUDA
The content presented in this post should help you understand how such bugs manifest and how to address similar issues in your own work.
Bug description
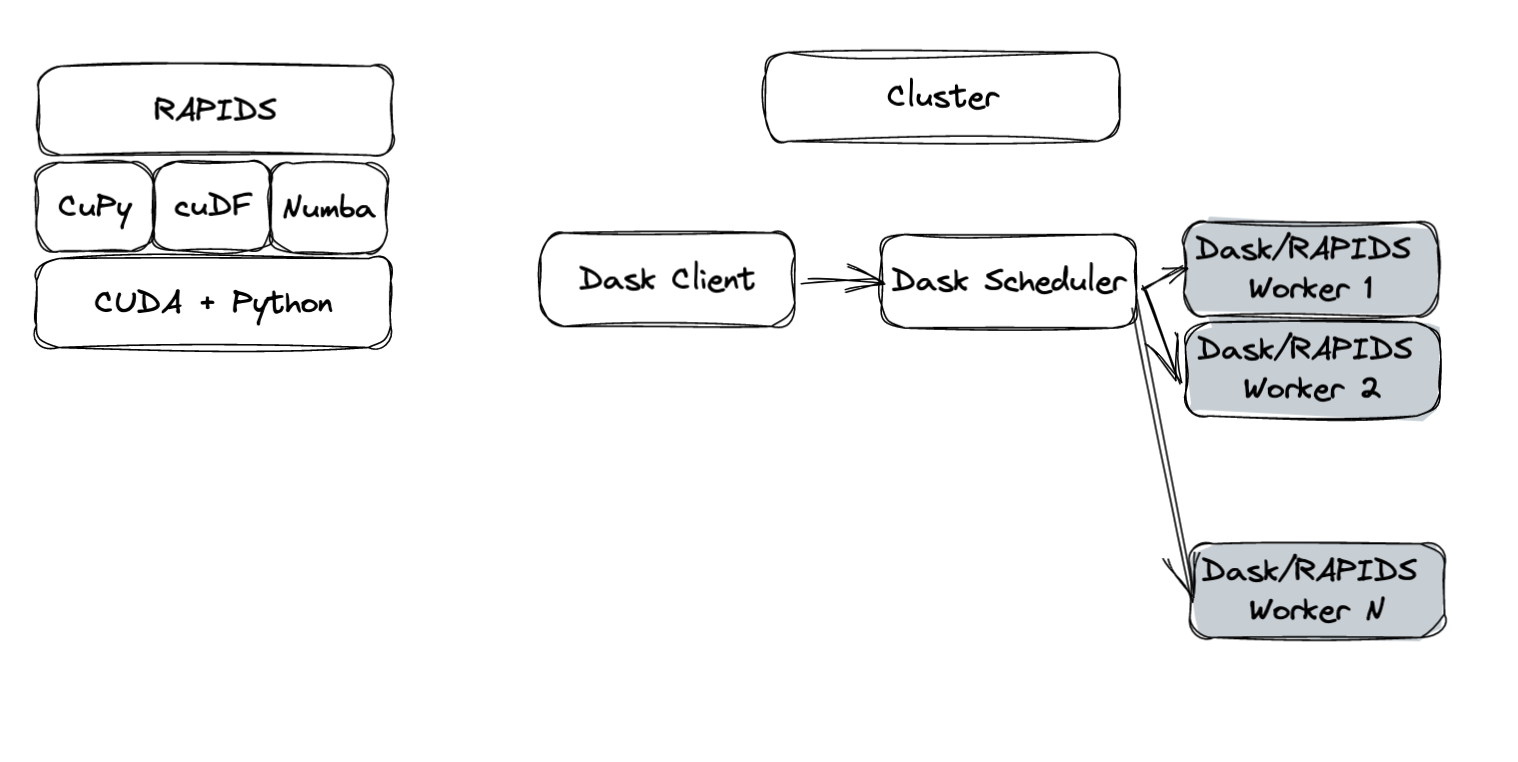
To be efficient and performant, RAPIDS depends on a variety of libraries for a multitude of different operations. To name a few, RAPIDS uses CuPy and cuDF to compute arrays and DataFrames on the GPU, respectively. Numba is a just-in-time compiler that can be used for accelerating user-defined Python operations on the GPU.
In addition, Dask is used to scale compute to multiple GPUs and multiple nodes. The last piece of the puzzle in the bug at hand is UCX, a communication framework used to leverage a variety of interconnects, such as InfiniBand and NVLink.
Figure 1 shows an overview of this stack. Although unknown at the time, a deadlock was occurring somewhere in this stack, preventing the workflow from completing.
This deadlock was first observed in August 2019, which was shortly after UCX was introduced in the stack. It turns out that the deadlock previously manifested itself without UCX (using the Dask default TCP communicator), except more infrequently.
A lot of time was spent exploring the space when the deadlock occurred. Though unknown at the time, the bug could have been in a particular operation, such as group by aggregation, merge/joins, repartitioning, or in a particular version of any of the libraries, including cuDF, CuPy, Dask, UCX, and more. There were many facets to explore as a result.
Prepare for debugging
The next sections walk you through how to prepare for debugging.
Set up a minimal reproducer
Finding a minimal reproducer is key to debugging anything. This problem was initially identified in a workflow running eight GPUs. Over time, we reduced this down to two GPUs. Having a minimal reproducer is critical to easily share a bug with others and get the time and attention from a broader team.
Set up your environment
Before diving into the problem, set up your environment. The bug can be minimally reproduced with the 0.10 version of RAPIDS (released in October 2019). It is possible to set up the environment with either Conda or Docker (see the respective sections later in this post).
This entire process assumes the use of Linux. Because UCX is not supported on Windows or MacOS, it is not reproducible on those operating systems.
Conda
First, install Miniconda. After the initial setup, we strongly recommend that you install mamba by running the following script:
conda install mamba -n base -c conda-forge
Then run the following script to create and activate a conda environment with RAPIDS 0.10:
mamba create -n rapids-0.10 -c rapidsai -c nvidia -c conda-forge rapids=0.10 glog=0.4 cupy=6.7 numba=0.45.1 ucx-py=0.11 ucx=1.7 ucx-proc=*=gpu libnuma dask=2.30 dask-core=2.30 distributed=2.30 gdb
conda activate rapids-0.10
We recommend Mamba for speeding up environment resolution. Skipping that step and replacing mamba with conda should work as well, but may be considerably slower.
Docker
Alternatively, you can reproduce the bug with Docker. After you have NVIDIA Container Toolkit set up, follow these instructions.
docker run -it --rm --cap-add sys_admin --cap-add sys_ptrace --ipc shareable --net host --gpus all rapidsai/rapidsai:0.10-cuda10.0-runtime-ubuntu18.04 /bin/bash
In the container, install mamba to speed up the environment resolution.
conda create -n mamba -c conda-forge mamba -y
Then, install UCX/UCX-Py, and libnuma, which is a UCX dependency. Also, upgrade Dask to a version that has integrated UCX support. For debugging later, also install GDB.
/opt/conda/envs/mamba/bin/mamba install -y -c rapidsai -c nvidia -c conda-forge dask=2.30 dask-core=2.30 distributed=2.30 fsspec=2022.11.0 libnuma ucx-py=0.11 ucx=1.7 ucx-proc=*=gpu gdb -p /opt/conda/envs/rapids
Debugging
This section details how this particular problem was encountered and ultimately fixed, with a detailed step-by-step overview. You can also reproduce and practice a few of the described concepts.
Running (or hanging)
The debugging issue in question is definitely not limited to a single compute problem, but it is easier to use the same workflow that we used in 2019. That script can be downloaded to a local environment by running the following script:
wget
https://gist.githubusercontent.com/pentschev/9ce97f8efe370552c7dd5e84b64d3c92/raw/424c9cf95f31c18d32a9481f78dd241e08a071a9/cudf-deadlock.py
To reproduce, execute the following:
OPENBLAS_NUM_THREADS=1 UCX_RNDV_SCHEME=put_zcopy UCX_MEMTYPE_CACHE=n UCX_TLS=sockcm,tcp,cuda_copy,cuda_ipc python cudf-deadlock.py
In just a few iterations (perhaps as few as one or two), you should see the preceding program hang. Now the real work begins.
The deadlock
A nice attribute about deadlocks is that the processes and threads (if you know how to investigate them) can show what they are currently trying to do. You can infer what is causing the deadlock.
The critical tool is GDB. However, much time was spent initially with PDB for investigating what Python was doing at each step. GDB can attach to live processes, so you must first find out what the processes and their associated IDs are:
(rapids) root@dgx13:/rapids/notebooks# ps ax | grep python
   19 pts/0    S      0:01 /opt/conda/envs/rapids/bin/python /opt/conda/envs/rapids/bin/jupyter-lab --allow-root --ip=0.0.0.0 --no-browser --NotebookApp.token=
  865 pts/0    Sl+    0:03 python cudf-deadlock.py
  871 pts/0    S+     0:00 /opt/conda/envs/rapids/bin/python -c from multiprocessing.semaphore_tracker import main;main(69)
  873 pts/0    Sl+    0:08 /opt/conda/envs/rapids/bin/python -c from multiprocessing.spawn import spawn_main; spawn_main(tracker_fd=70, pipe_handle=76) --multiprocessing-fork
  885 pts/0    Sl+    0:07 /opt/conda/envs/rapids/bin/python -c from multiprocessing.spawn import spawn_main; spawn_main(tracker_fd=70, pipe_handle=85) --multiprocessing-fork
Four Python processes are relevant to this problem:
- Dask Client (
865) - Dask Scheduler (
871) - Two Dask workers (
873and885)
Interestingly enough, significant progress has been made in debugging Python since this bug was initially investigated. In 2019, RAPIDS was on Python 3.6, which already had tools to debug lower stacks but only when Python was built in debug mode. That required potentially rebuilding the entire software stack, which is prohibitive in complex cases like this.
Since Python 3.8, the debug builds use the same ABI as release builds, greatly simplifying debugging the C and Python stacks combined. We don’t cover that in this post.
GDB exploration
Use gdb to attach to the last running process (one of the Dask workers):
(rapids) root@dgx13:/rapids/notebooks# gdb -p 885
Attaching to process 885
[New LWP 889]
[New LWP 890]
[New LWP 891]
[New LWP 892]
[New LWP 893]
[New LWP 894]
[New LWP 898]
[New LWP 899]
[New LWP 902]
[Thread debugging using libthread_db enabled]
Using host libthread_db library "/lib/x86_64-linux-gnu/libthread_db.so.1".
0x00007f5494d48938 in pthread_rwlock_wrlock () from /lib/x86_64-linux-gnu/libpthread.so.0
(gdb)
Each Dask worker has several threads (communication, compute, admin, and so on). Use the gdb command info threads to inspect what each thread is doing.
(gdb) info threads
  Id   Target Id                                        Frame
* 1    Thread 0x7f5495177740 (LWP 885) "python"         0x00007f5494d48938 in pthread_rwlock_wrlock () from /lib/x86_64-linux-gnu/libpthread.so.0
  2    Thread 0x7f5425b98700 (LWP 889) "python"         0x00007f5494d4d384 in read () from /lib/x86_64-linux-gnu/libpthread.so.0
  3    Thread 0x7f5425357700 (LWP 890) "python"         0x00007f5494d49f85 in pthread_cond_timedwait@@GLIBC_2.3.2 () from /lib/x86_64-linux-gnu/libpthread.so.0
  4    Thread 0x7f5424b16700 (LWP 891) "python"         0x00007f5494d49f85 in pthread_cond_timedwait@@GLIBC_2.3.2 () from /lib/x86_64-linux-gnu/libpthread.so.0
  5    Thread 0x7f5411fff700 (LWP 892) "cuda-